The Bridge That Thought It Was Underwater: Rebuilding Our 3D Rides on Real Map Data
How we rebuilt VeloWorkout 3D rides on real map data after coastal routes were rendering as pine forest.
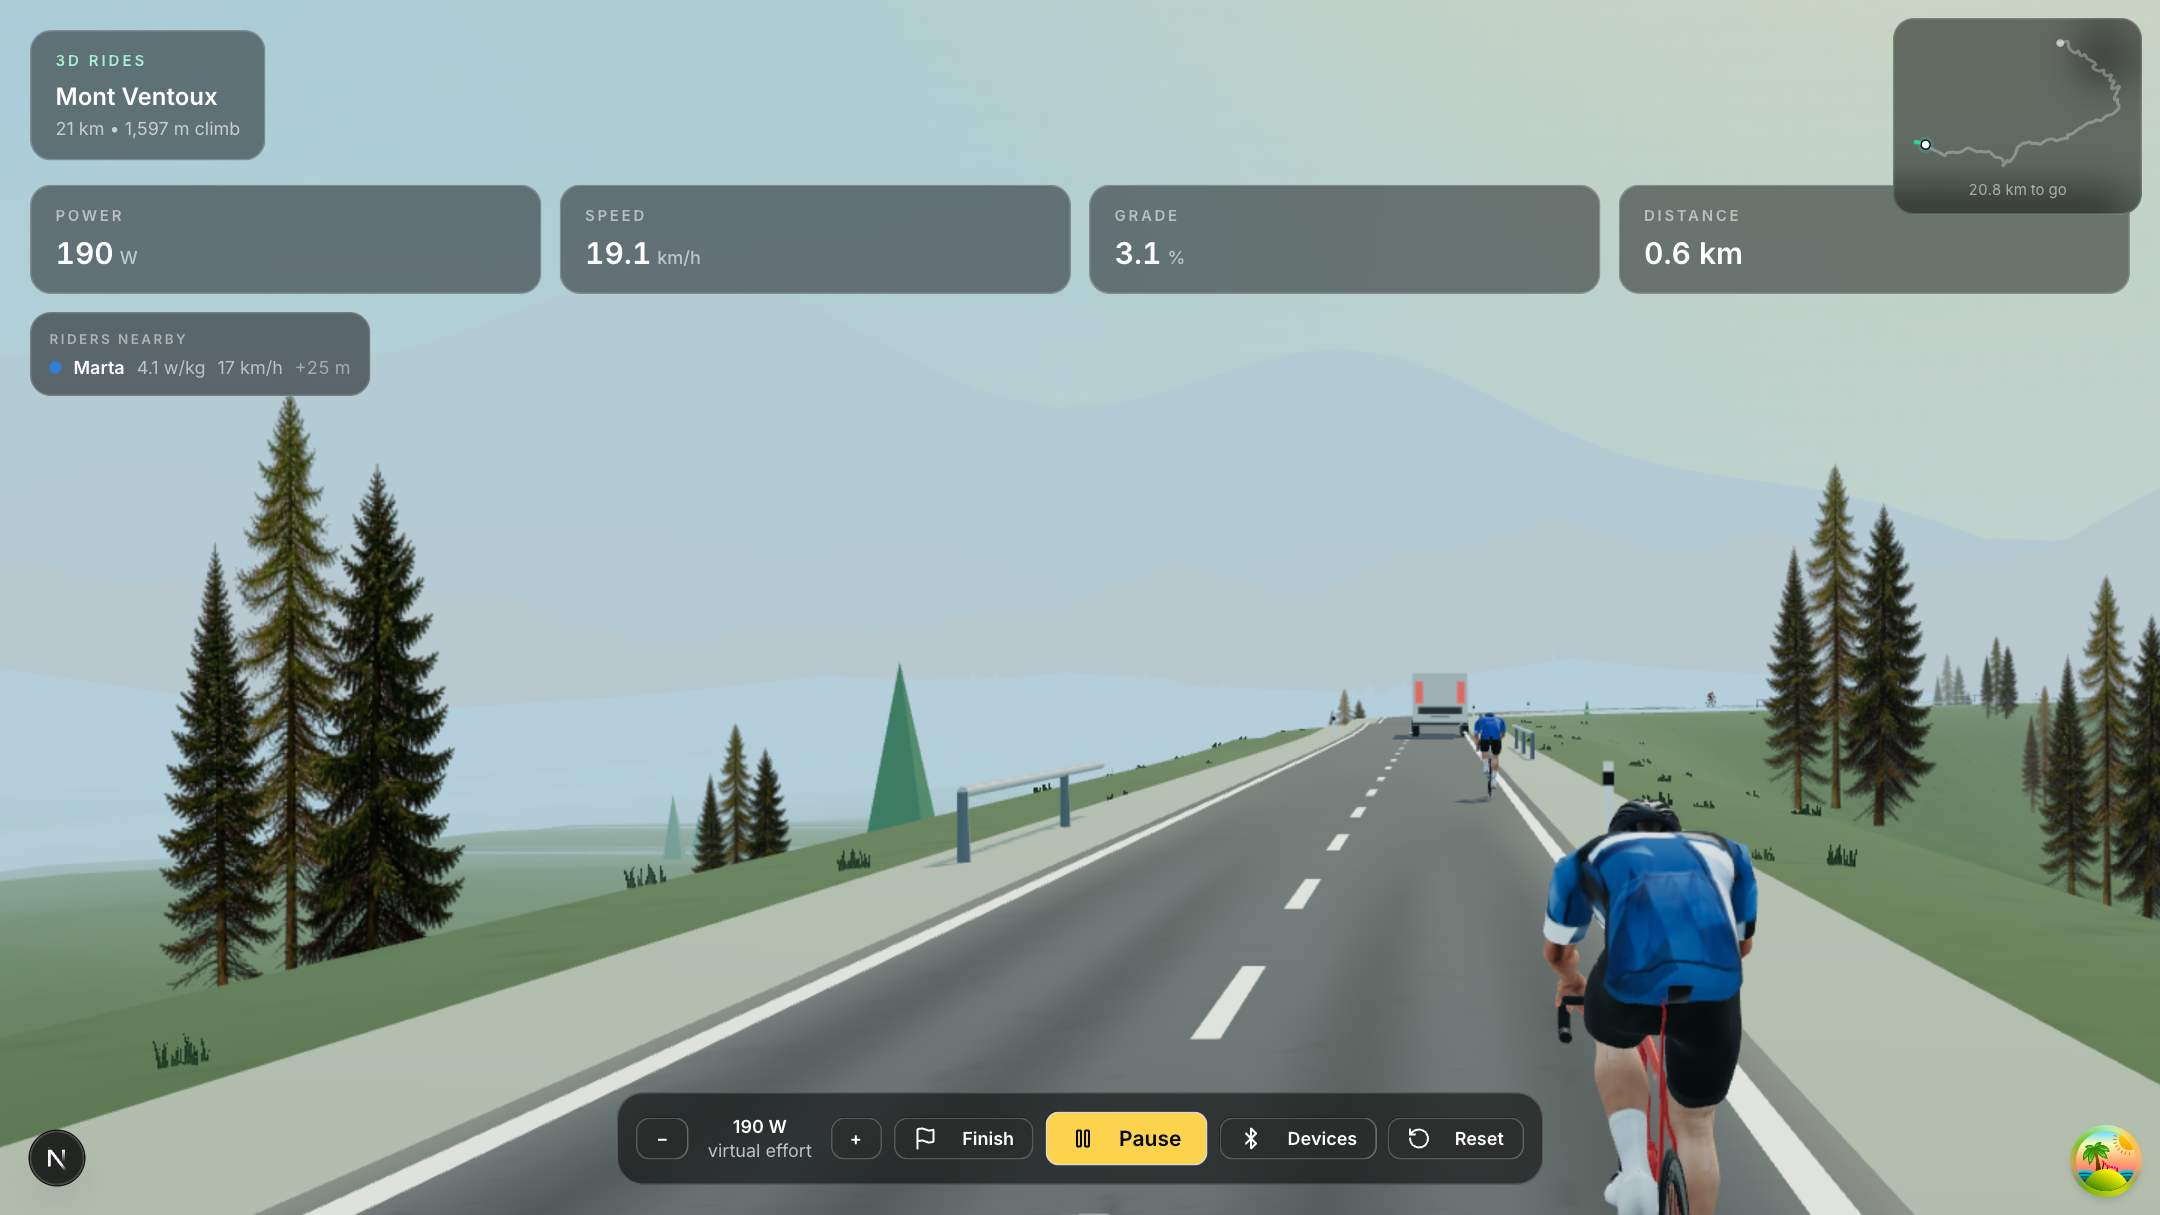
Not long ago, a rider told us their coastal route came out as a pine forest. They were riding beside open water; VeloWorkout showed them trees.
They were right, and the reason turned out to be more interesting than a bug.

Every virtual road is a guess
Until recently, the world beside our 3D routes was invented. We took the elevation profile of the road — how high it was, how much it climbed — and inferred the rest. Low and flat? Probably coast. High and steep? Probably alpine. Then we generated hillsides out of fractal noise and scattered trees on them.
That works surprisingly well until it doesn't. An elevation profile cannot know the sea is there. Altitude is not geography.
So we stopped guessing and started asking OpenStreetMap.
The sea is not on the map
Here is the first thing that surprises you: OpenStreetMap does not contain the ocean. There is no big blue polygon labelled "Atlantic". What it has is coastline — the line where land stops.
The trick is a convention. OSM coastlines are drawn so that land is always on the left of the way's direction and water is always on the right. That single rule is enough to reconstruct the sea from its edge, and it is how open water gets drawn beside your route at all.
Buildings, forests, farmland and lakes are mapped directly, so those we simply place where they are. Ride through a village now and the houses are the houses.
The bridge that thought it was underwater
Then we hit something stranger. On one test route, a long suspension bridge sat at two metres in our elevation profile. The real road crosses about sixty metres above the water.
Elevation models measure the ground. Where a road crosses on a bridge, the model faithfully reports the water underneath it. A satellite does not know the difference between a road and the thing below the road — so our rider descended into the water, crossed at sea level, and climbed back out the other side.
Fixing it takes three ingredients:
- OpenStreetMap knows it is a bridge — including, from the
bridge:structuretag, whether it is a suspension bridge, a beam or an arch. - The road's height at each end is real — the abutments sit on ground the model measured correctly.
- A deck arcs. A long span rises toward the middle, and that camber is exactly what gives ships clearance underneath.
Put those together and the deck lands within a metre of its true height.
Tunnels have the opposite problem
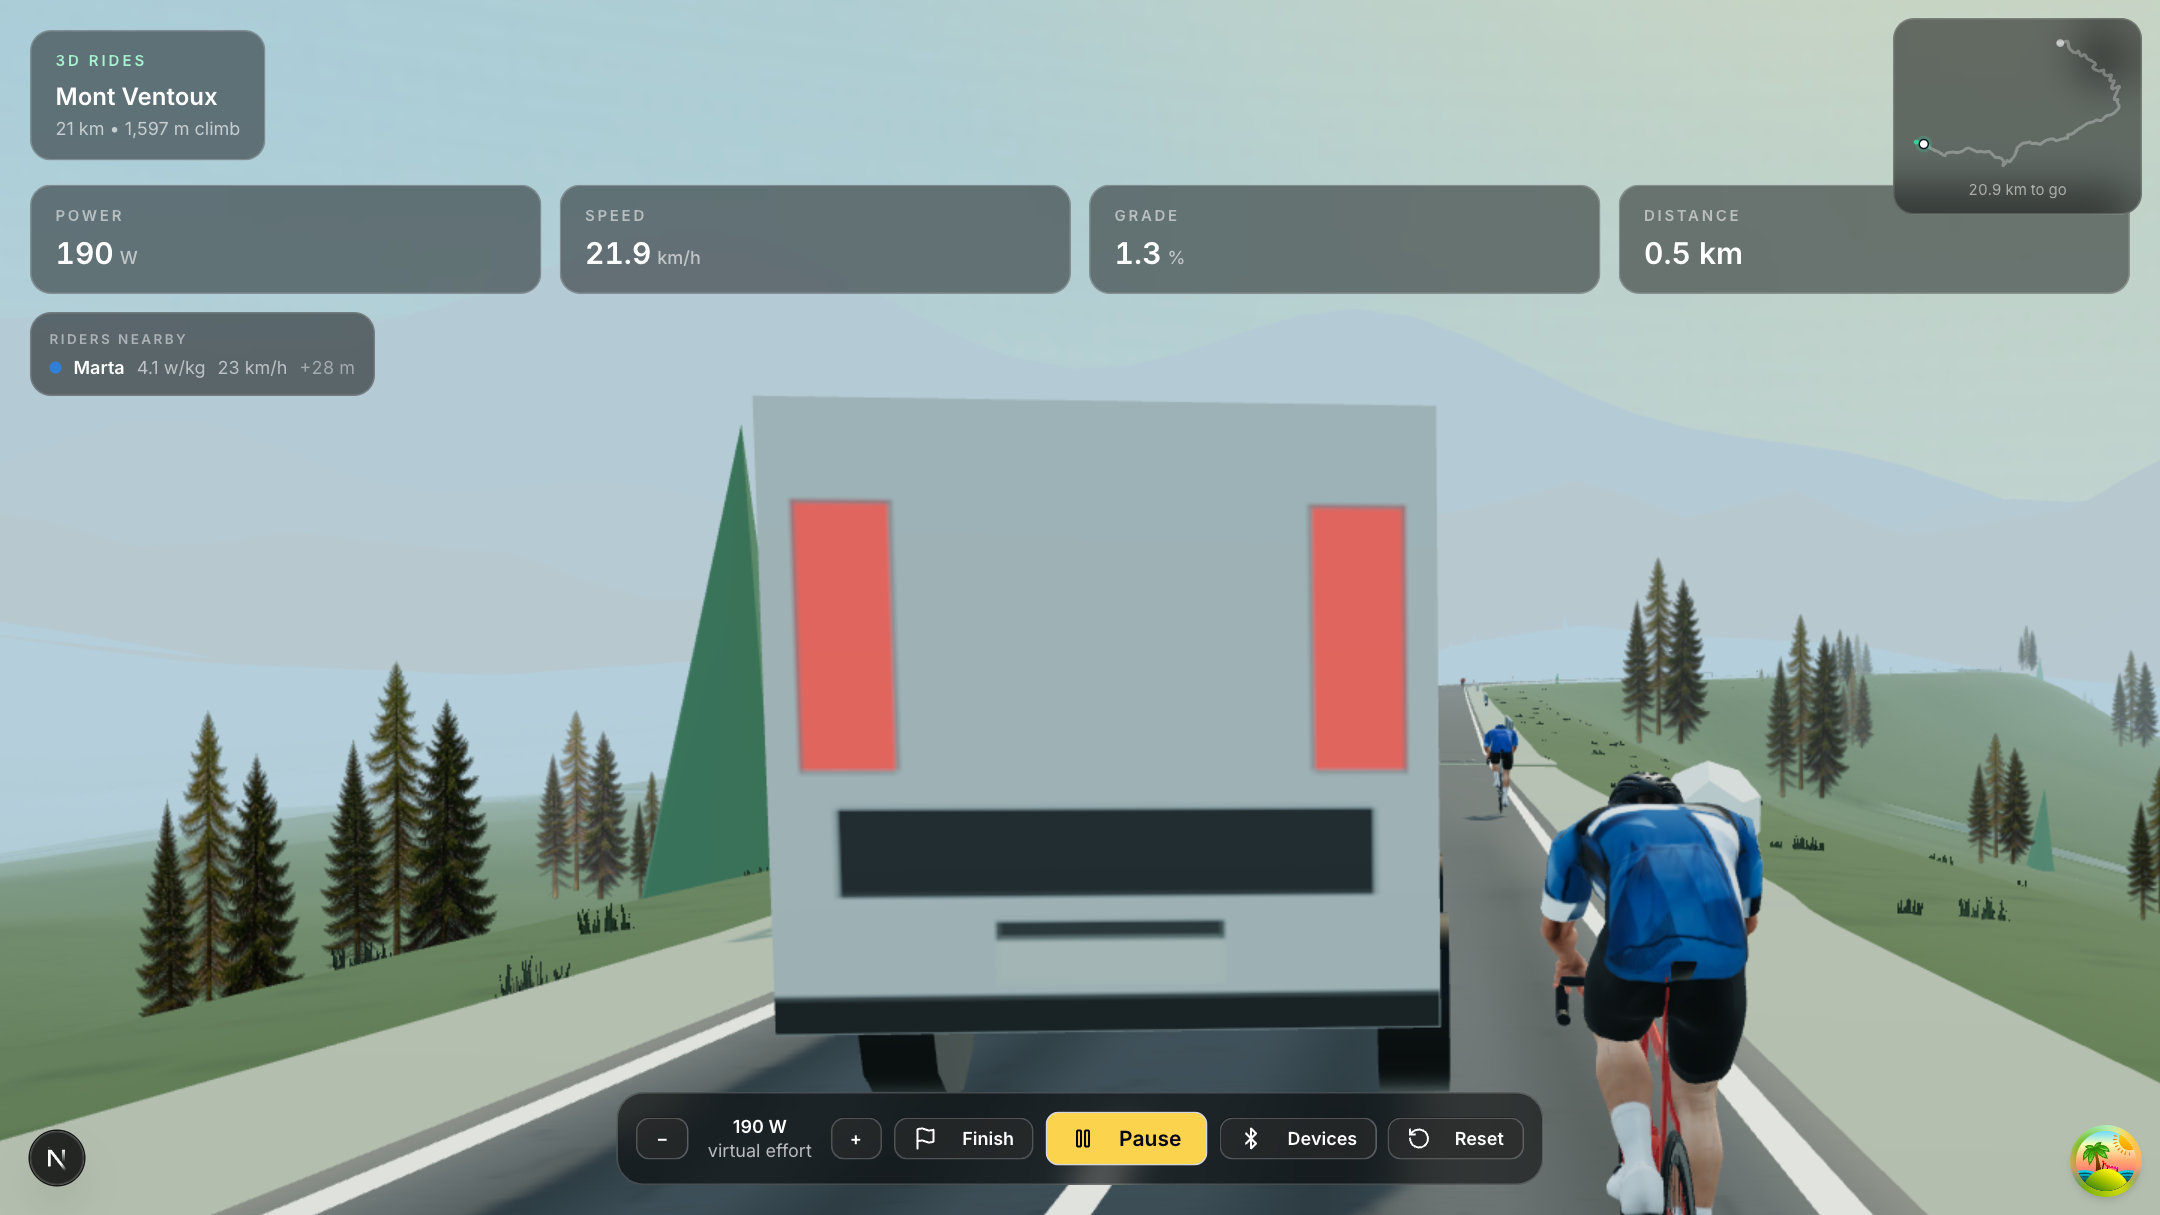
A tunnel is the same mistake inverted. The elevation model reports the mountain the road goes through, so the profile climbs over the top of it. One of our test tunnels was, according to the raw data, a 24% climb through solid rock.
Tunnels are engineered things, and a bored road tunnel is not built at 24%. Knowing that is enough to bound the gradient and put the road back where it belongs — lit, enclosed, and flat enough to ride.
Ground that buildings can stand on
The last piece was the ground itself. We now sample real elevations across a corridor around every route, so a house four hundred metres away sits on the hillside it actually sits on. Before, we placed buildings at the height of the nearest road — which was wrong by an average of 19 metres, and by 74 metres at worst. They floated.
That data is shared between routes. Elevation and landcover describe the world, not your particular ride, so we store them by place. Two riders crossing the same water fetch it once between them, and the second route is ready instantly.
What this means on the bike
Nothing you have to do. Save a route and it prepares itself: the map data, the ground heights, the bridges and tunnels are all fetched while it saves.
Then ride it. Cross a real bridge and you will feel the deck rise under you and see the water a long way below. Go into a tunnel and the lights come on. Pass a village and the buildings are where the buildings are.
It is the same route you would ride outside. That was always the point.
VeloWorkout's 3D rides work with any route you plan, and with your smart trainer for real gradient. Map data © OpenStreetMap contributors. Elevation data from the Copernicus DEM.
That same map data now draws every 2026 Tour de France and Vuelta stage, if you want to ride one of them.
Turn your training plan into actual progress
Build workouts, execute with smart trainer support, and track performance with data that matters.
Open VeloWorkout